Basemaps come in a variety of types, styles and scales for you to choose from, from full detail to muted backgrounds. But have you ever taken a closer look and considered EXACTLY what context you want to provide with your basemap? What is it that we really need in a basemap? As well as giving scale and grounding our data in place, they can also provide all sorts of other information – such as landform, roads, landmarks and political boundaries. Depending on the type of data you are working with, some of this will be useful to you, some will not.
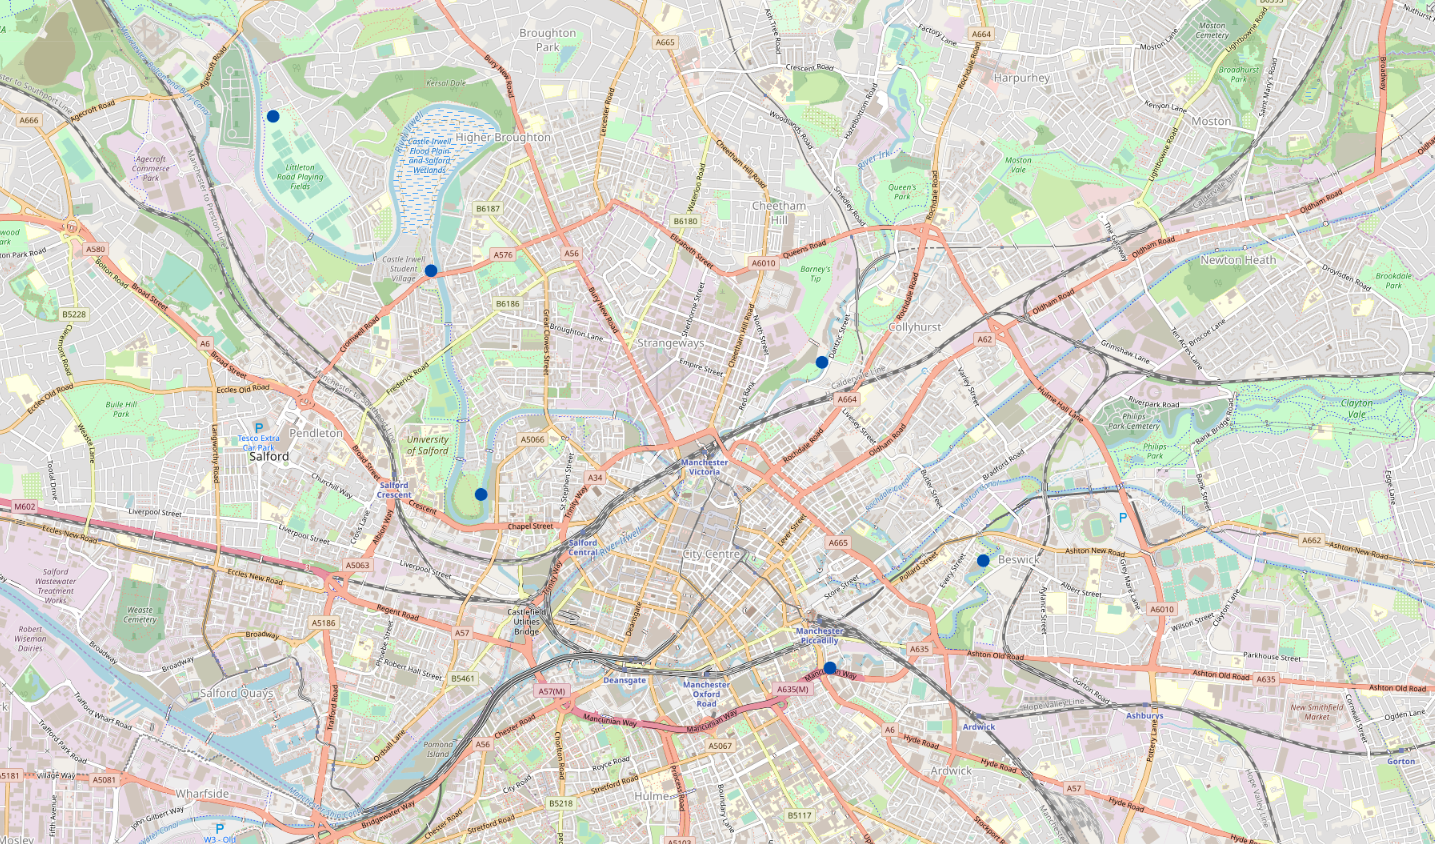
Lets look at an example. I’m working with a living Atlas dataset of Live Stream Gauges, therefore I want a basemap showing the river network. Below you can see my stream gauges as dark blue points over the OpenStreetMap basemap. This shows the details of all the rivers, but it’s rather busy as a basemap:
I’m not all that interested where the roads and building are and these distract from my data. Let’s choose something cleaner. The Light Grey Canvas is much better for showcasing my dataset:
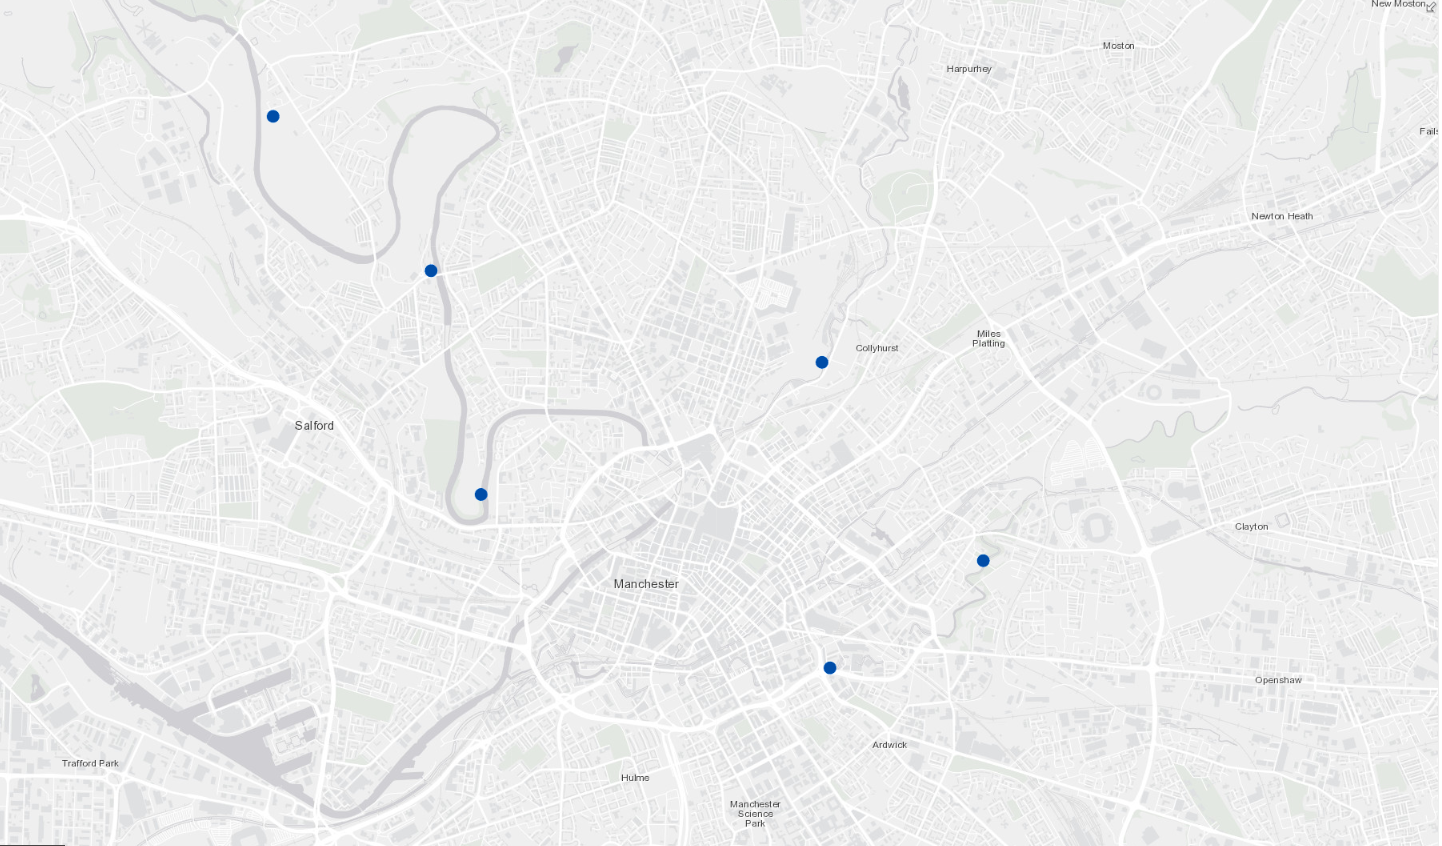
However, I would like to be able to see my rivers more prominently, they disappear a little on this basemap, and it’s not the easiest to distinguish them quickly from the roads.
So how can I achieve this? I could bring in an additional dataset showing the UK river networks, however there is no need, all the information on the rivers is already here. I just need to make some subtle changes to the symbology and I can have the perfect basemap. This is where vector basemaps come in – you have the ability to edit them!
What are vector basemaps?
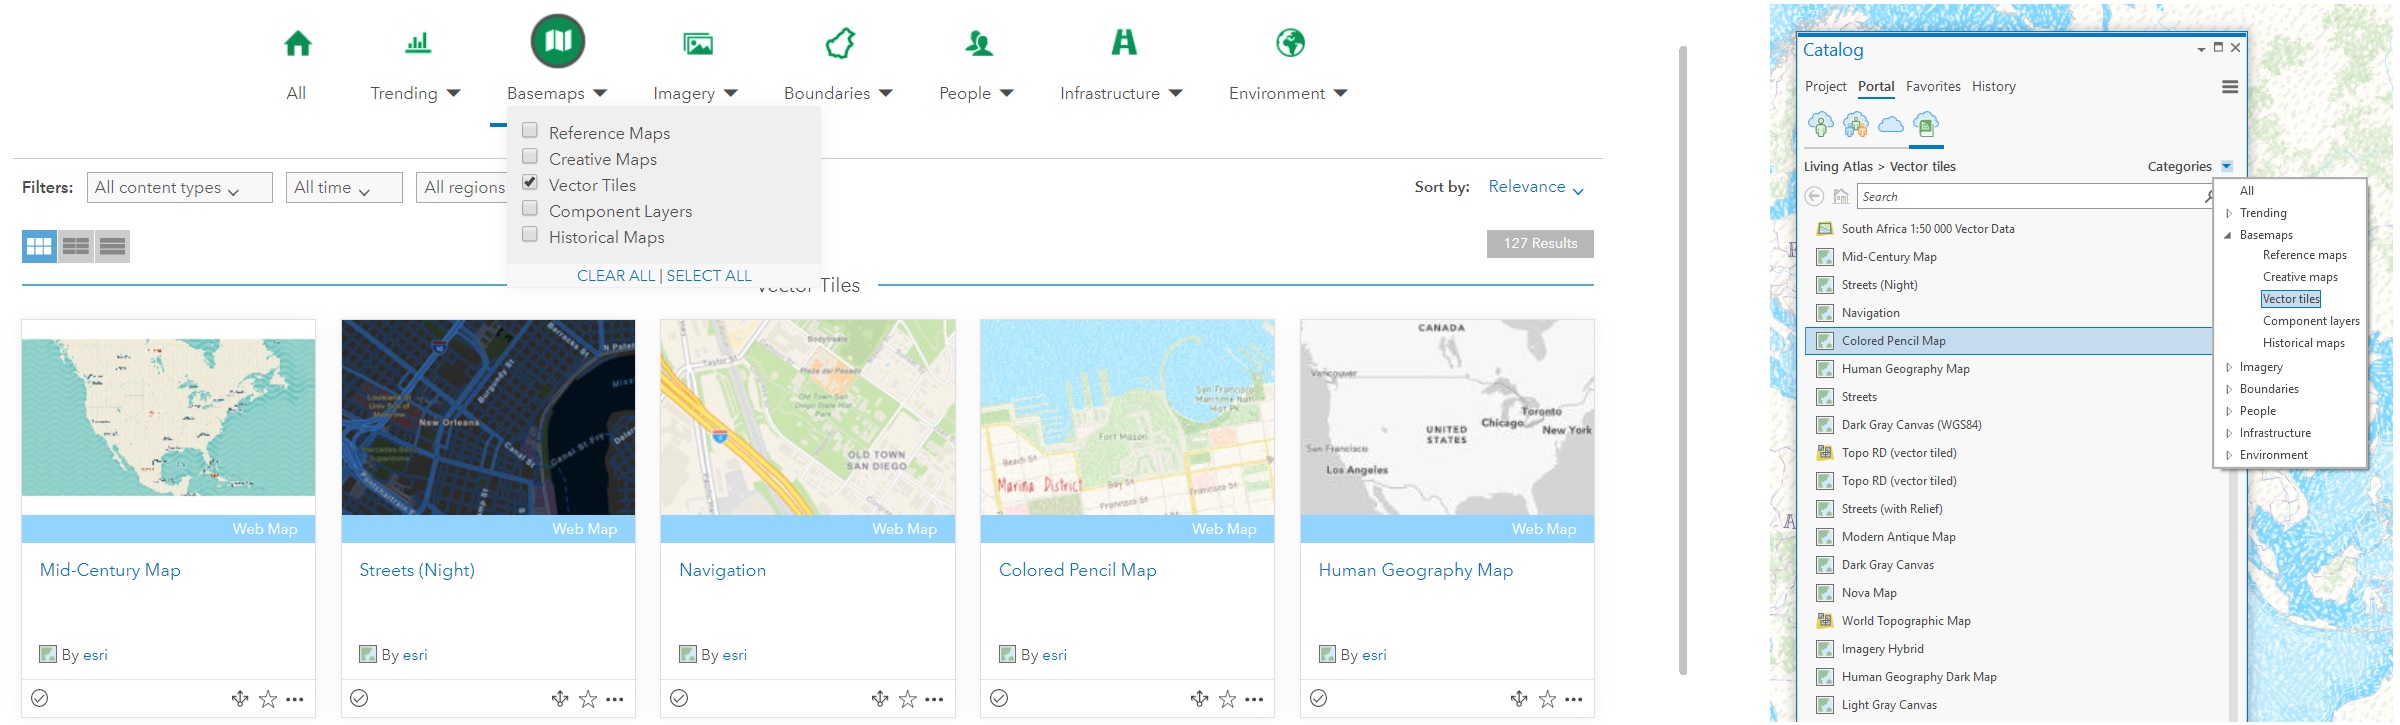
Basemaps have previously been served out as rasters, i.e. images. The big difference is that vector basemaps are a collection of vector features (points, lines and polygons) with attributes. This means that the symbology of those features can be changed. The Esri Living Atlas Content Team has added vector versions of most of our traditional basemaps, as well as new styles – from multi-layered functional maps like Human Geography, to heavily stylised ones like Colored Pencil and Nova. Find all these basemaps in the Living Atlas (below left) or browse for them from ArcGIS Online or ArcGIS Pro (below right):
These basemaps originate as a Vector Tile Package and are published with a default style.. As with traditional basemaps, the information is broken up into easily-rendered pieces, but the vector data is retained and it is rendered client-side. The basemaps are generally more recent, more efficient, high resolution when necessary, and, most importantly for this exercise, editable!
Editing vector basemaps
So how does editing vector basemaps work in practice? Fortunately for us, Esri have made this super easy to do using the ArcGIS Vector Tile Style Editor. The app leads you through most of the simpler changes you can make to the map style. For most tasks this will make life much easier for you. If you are keen to get really stuck in, check out how to perform more detailed editing using the JSON Code Editor in conjunction with the Esri Vector Basemap Reference Document.
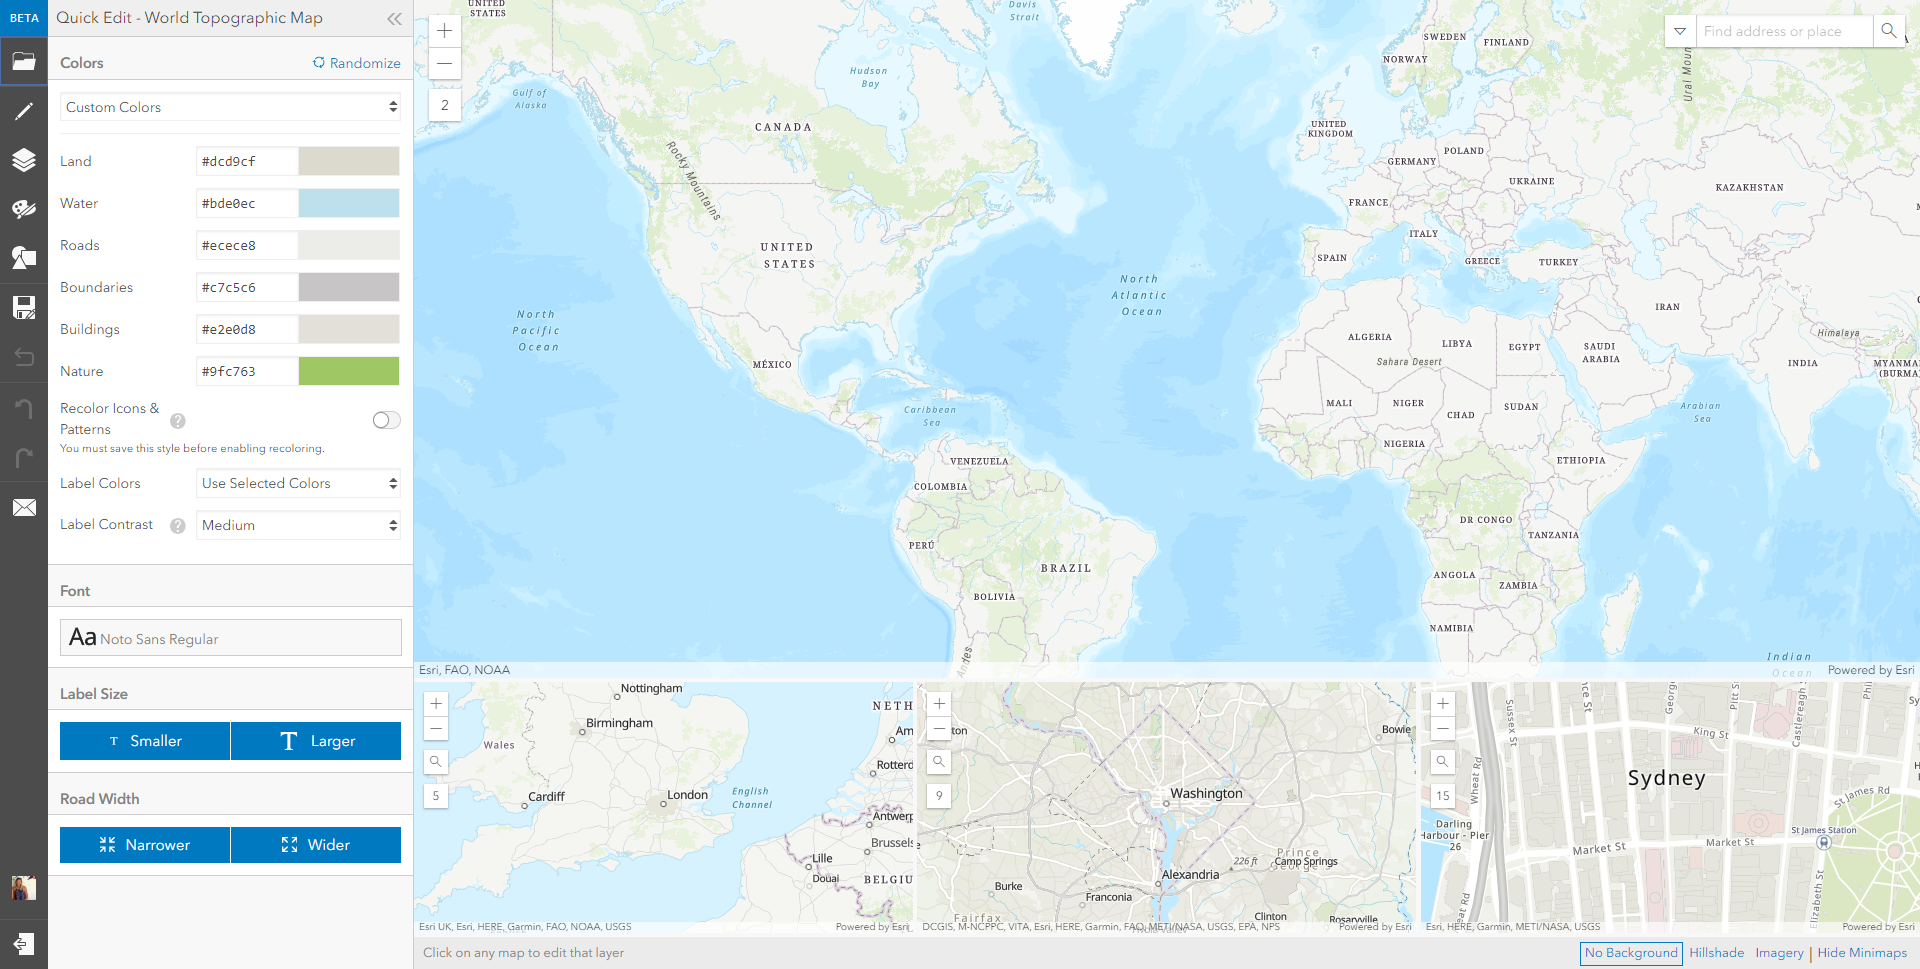
Lets go back to the stream gauges. I’m looking for a simple canvas basemap, but would like to highlight the river network. I’ve started by choosing the basemap that is closet in content to my requirement – the Light Grey Canvas vector tile basemap – you can work with any of Esri’s vector basemaps or your own custom vector styles. To pull out my river network from the canvas basemap I can simply select the Rivers layer in the vector basemap and change the colour. I can even use custom hex codes if I’m working to a theme.
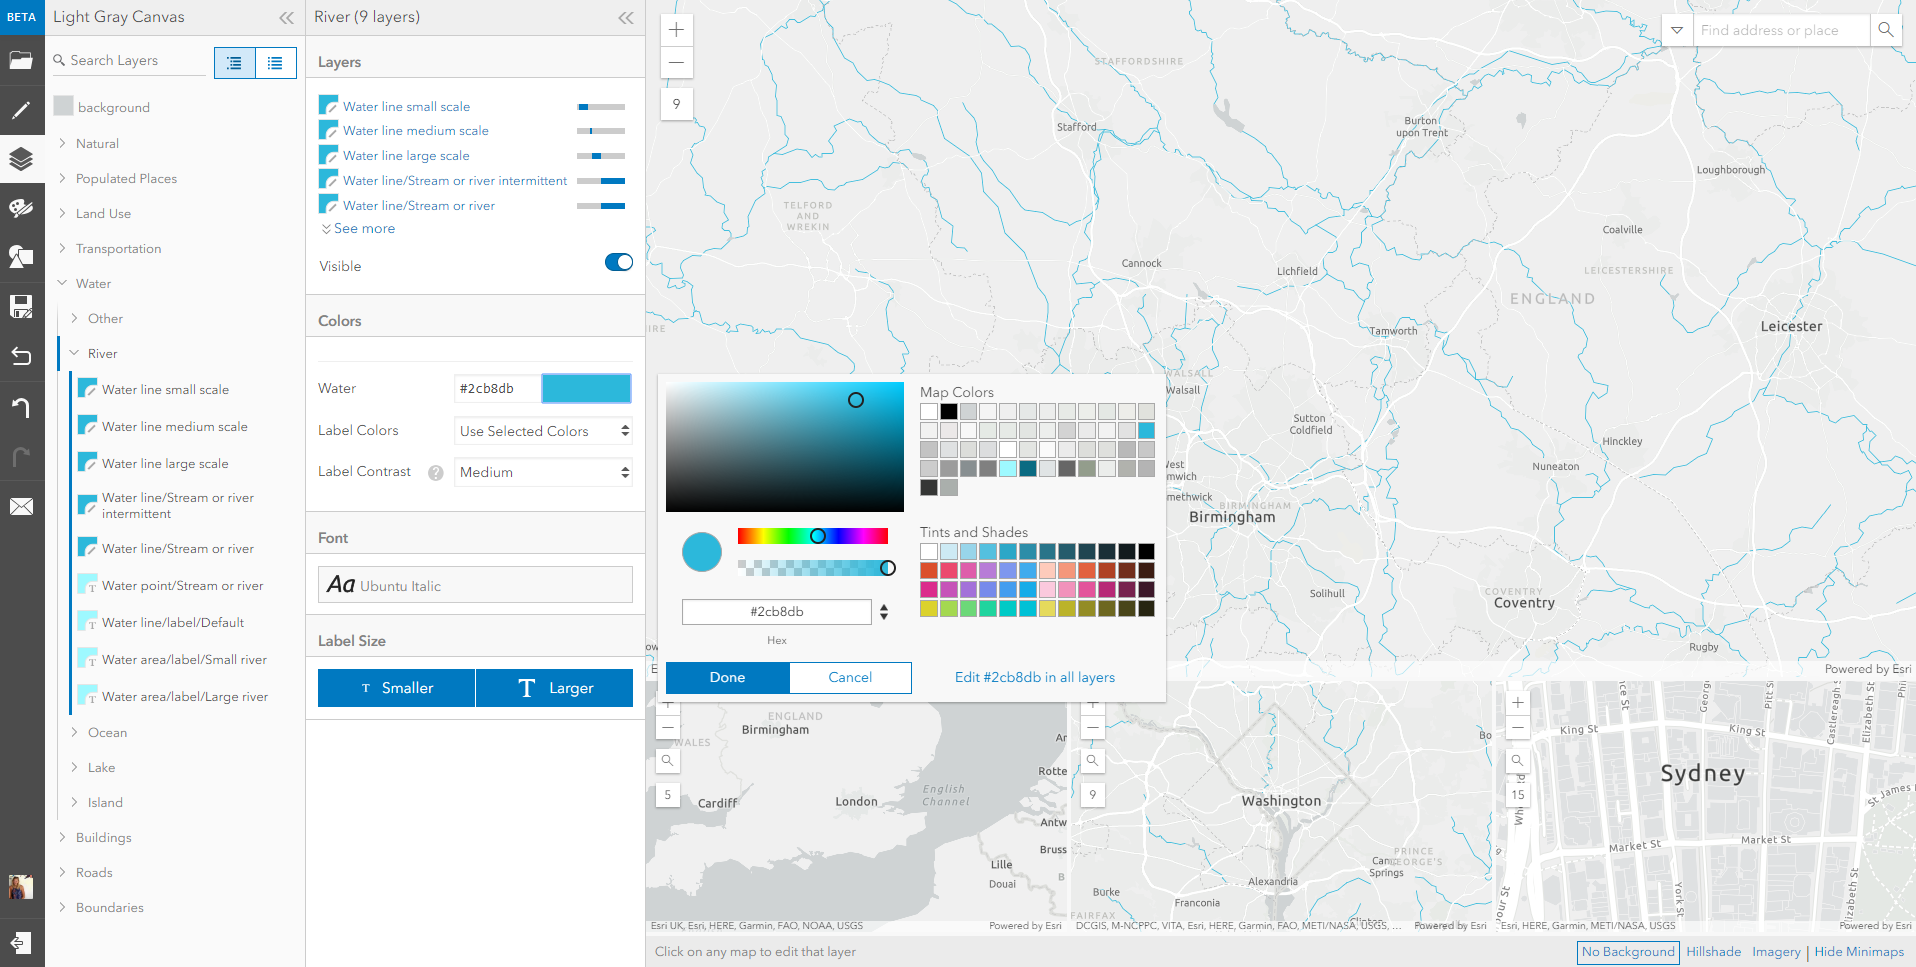
I decided here to change the colour of my rivers to a light blue. I now have a custom basemap ready to go (below), designed specifically for my needs. I can very clearly see my river networks and the locations of the stream gauges – easy!
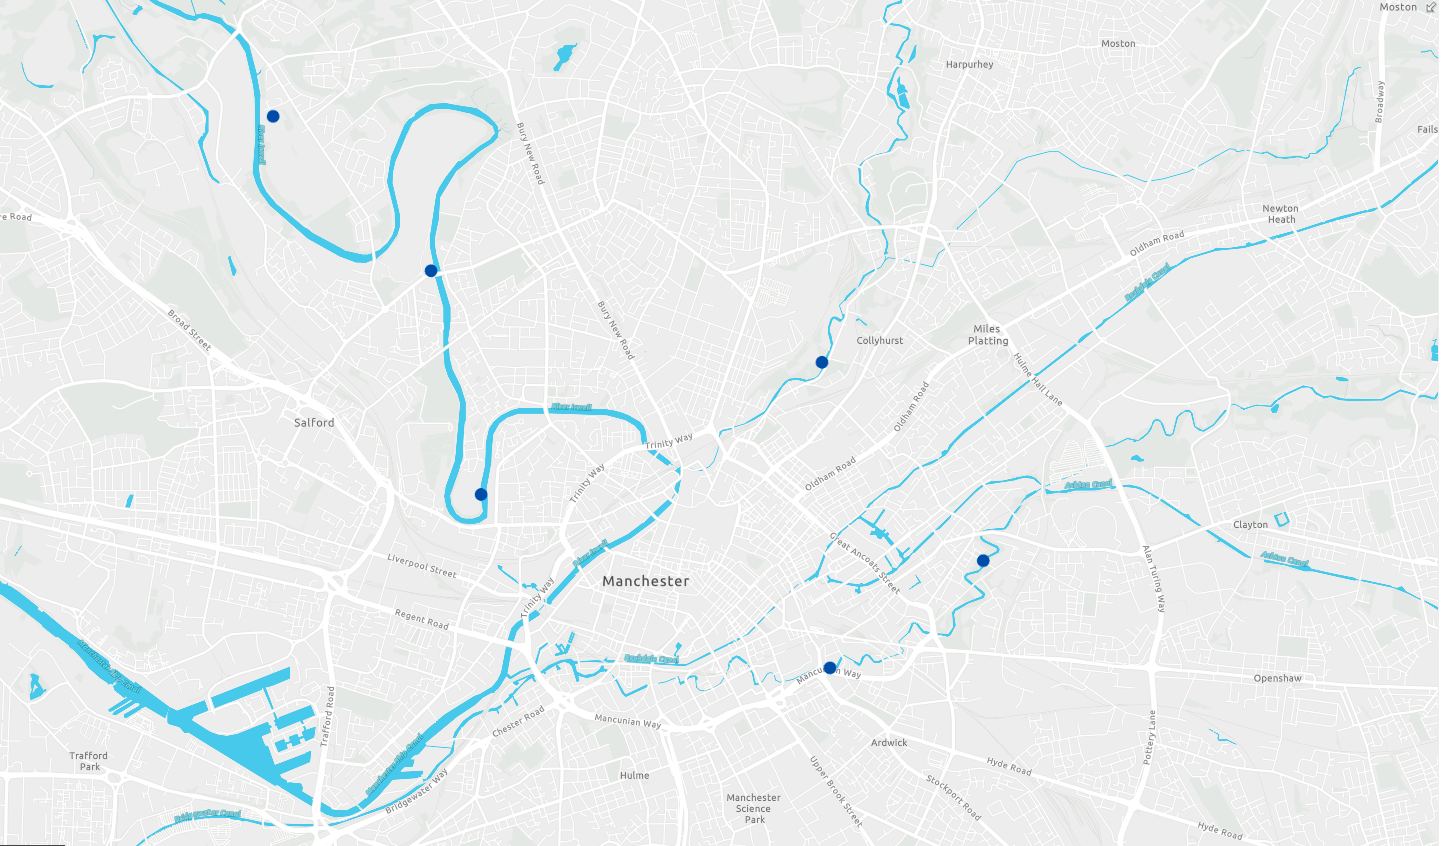
This tool makes our basemaps really valuable as it allows us to be selective and pull out the layers that matter, as well as subduing what is of less interest. We end up with more intuitive and informative outputs, that enable better visualisation and faster decision making.
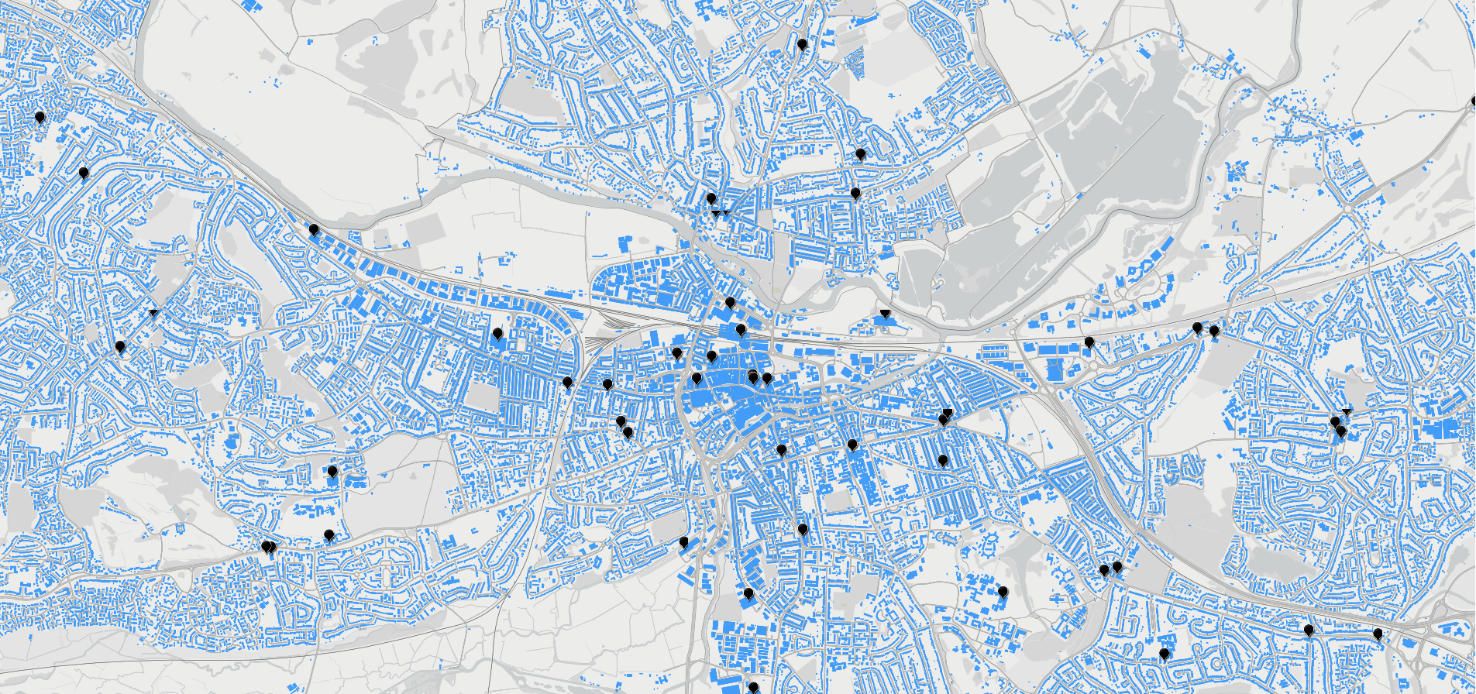
From urban areas to roads, as well as rail, parking, transportation, education, canals, lakes oceans, political boundaries and even zoos, there is a lot of useful information in basemaps for you to use – go and explore it. This map uses a Living Atlas dataset of UK supermarkets from Geolytix. I’ve edited the Dark Gray Canvas basemap to pull out all of the buildings in blue:
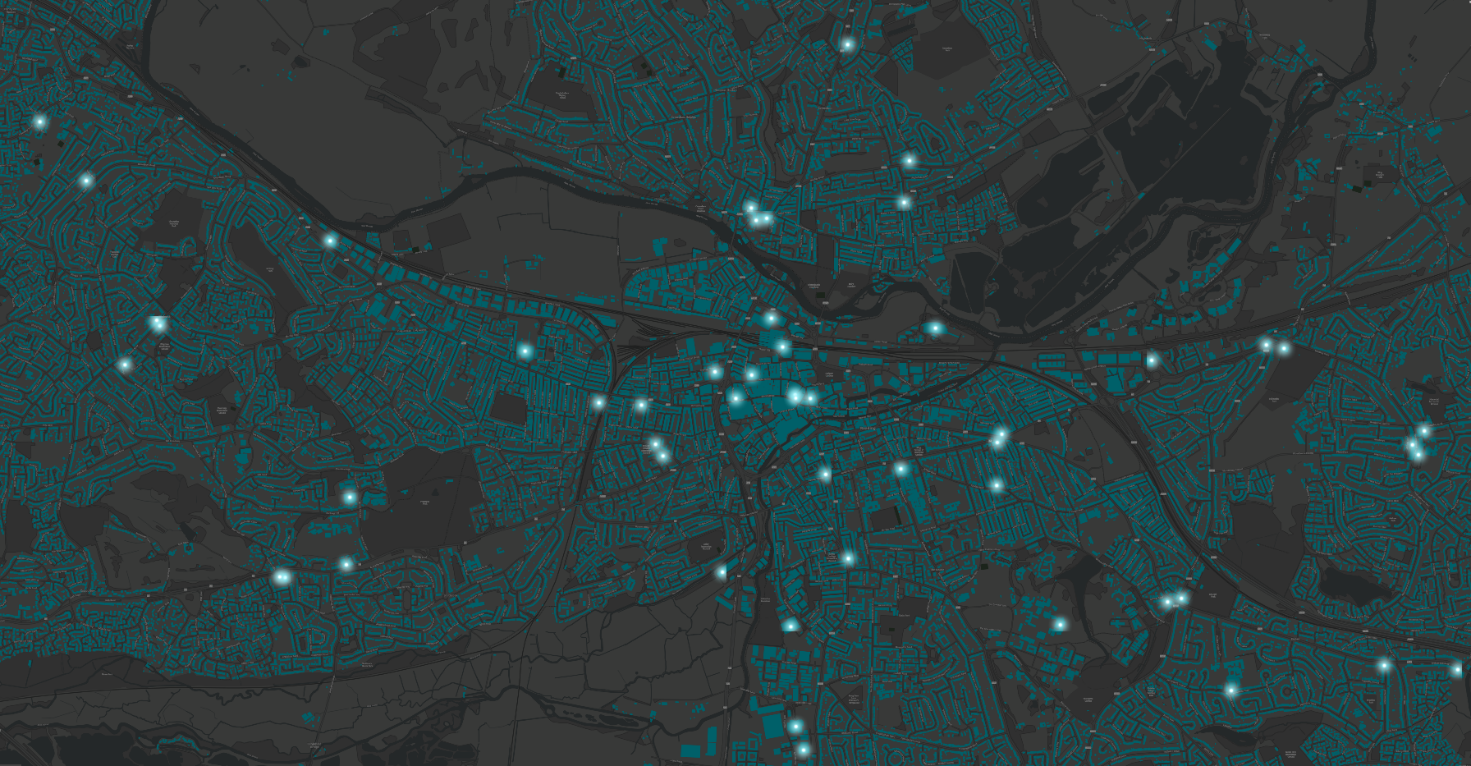
Here is the same map but made with the Light Gray Canvas.
For more information on the editing capabilities of vector basemaps please see the blog Customizing Esri Vector Basemaps, For a full list of vector basemap features, label subtypes, min/max zoom levels, disputed boundary codes and fonts for use with the Esri vector basemaps, please see the PDF Esri Vector Basemap Reference Document (v2) which contains all the information related to the current service URL.
Make your basemaps work for you – go on, give it a try!
![]()