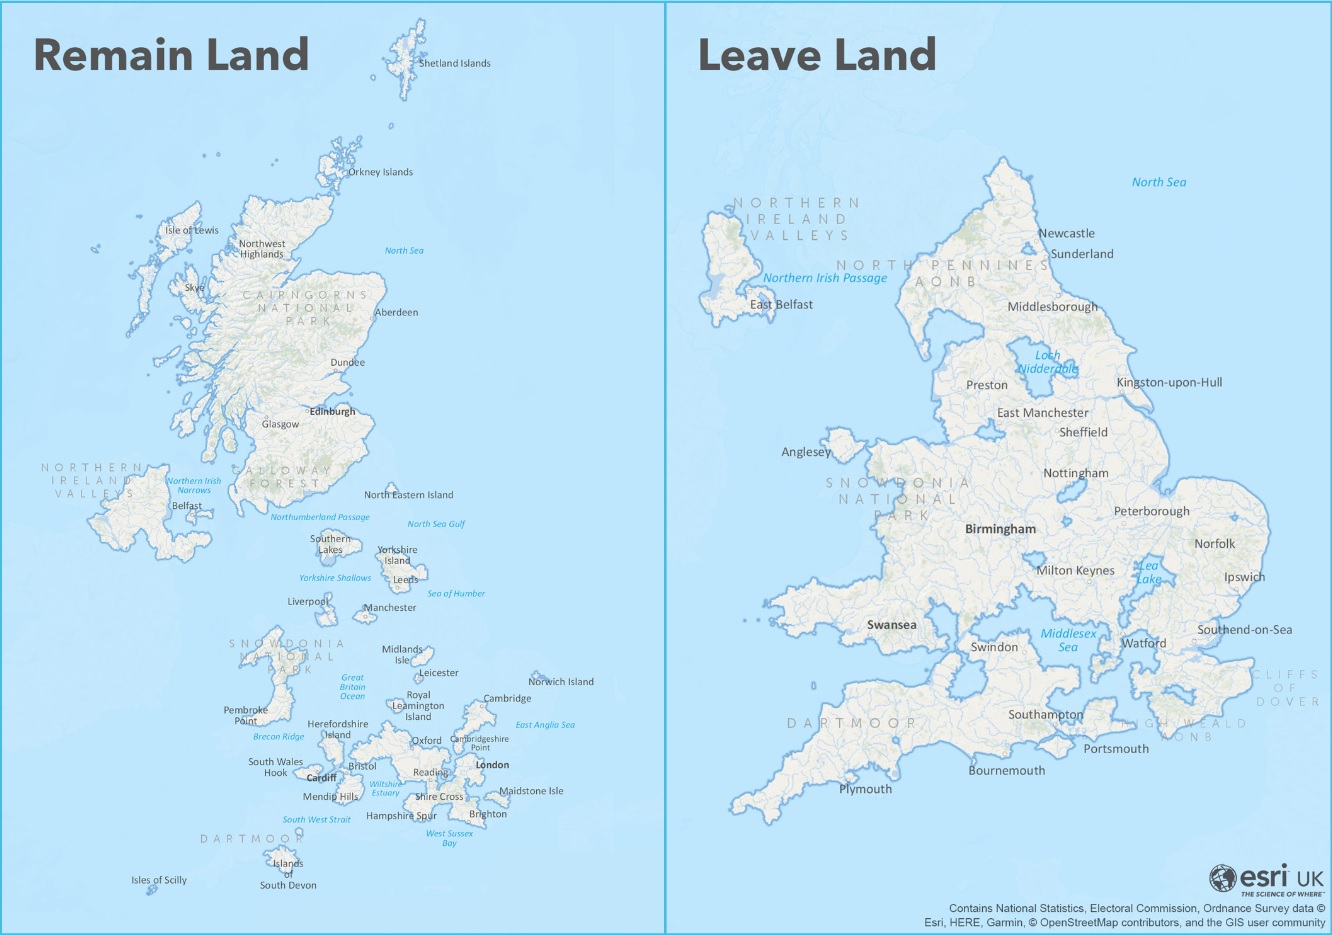
How would the UK look if you were to only keep the land areas that voted leave or remain respectively?
Our Brexit Isles maps are inspired by the cartographic map of ‘Two Americas’ made by Tim Wallace in 2016. This blog will follow the steps used to create the maps and some of the cartographic choices made by the Media Maps team.
The approach
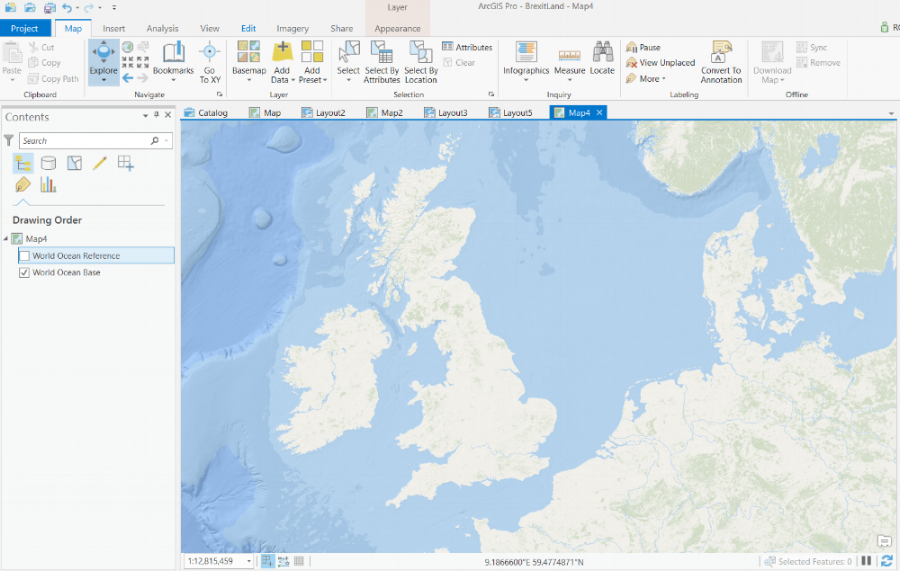
To begin with, a basemap must be chosen that is suitable for showing land areas without losing the details of geographic features (mountains, rivers, lakes and coastlines). For this project the World Oceans basemap, included with ArcGIS Pro, was used. I chose to keep the Transparency at 0% but turn the place labels (the reference layer) off, to avoid cluttering the map whilst I was editing away.
I brought in a CSV file containing the remain or leave attributes for each local authority area, which was obtained from the Electoral Commission for England, Wales and Scotland and the Electoral Office of Northern Ireland.
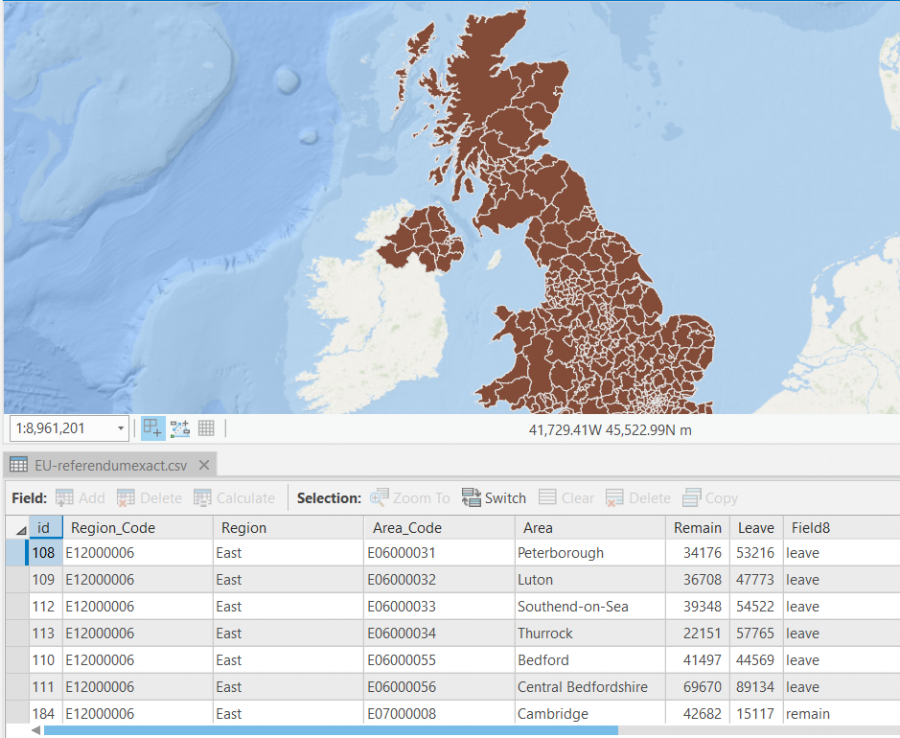
After importing the data, a join was used on a Local Authority Area shapefile from the Ordnance Survey that would be used to visualise the data. I chose to join the data by the GeoCode attribute as this was more accurate than the slight differences in area/region names between the two files.
Cartographic decisions
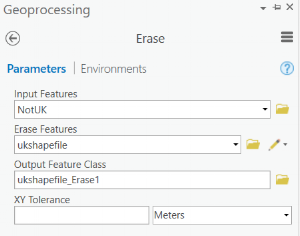
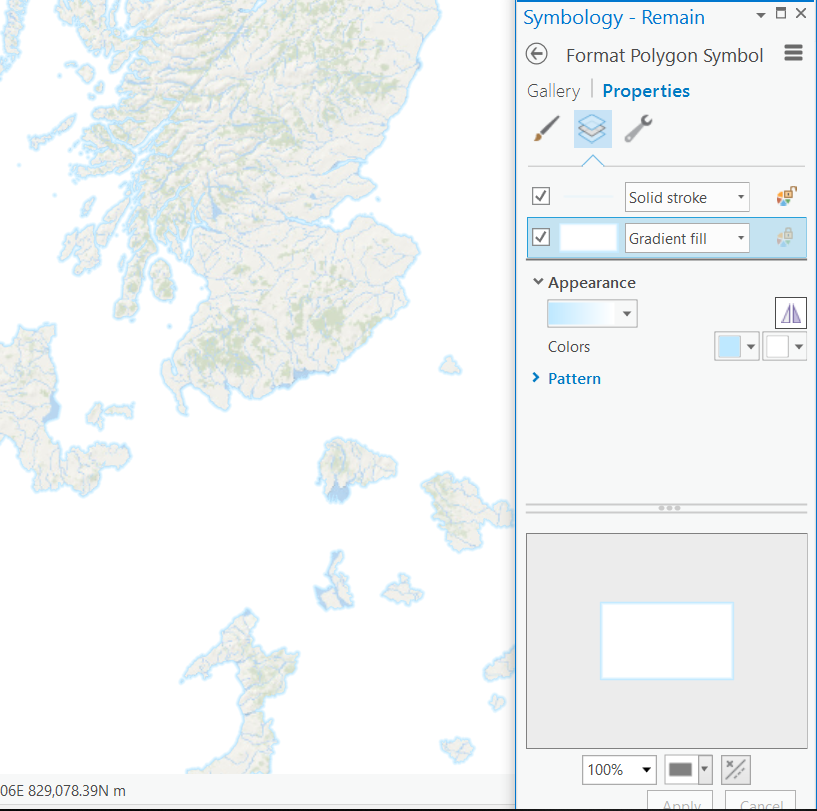
I appreciated the country outlines that Tim’s map used - highlighting the new coastlines - and decided to keep a similar style. This meant only adding a slight tint to the coastlines around the various islands. This was quick using the handy Gradient Fill option within the Symbology tab and adjusting the colour for the edges of the water until happy with the outcome. I chose a lighter blue that was more in line with the blue used for the lakes and rivers in the basemap, but it is personal preference.
This map already begins to show each of the new islands. Choosing to add place names to the map helps the reader orientate themselves and not merely see a collection of islands that vaguely resemble the UK. The labels were added manually within the Layout view for each location with a simple transparent circle to identify a place location and a basic font as to not draw too much attention to the places themselves, some examples of this are below. Following simple cartographic design principles I used a different font and style for natural areas and water features to add some realism to the islands. I wanted the reader to believe the different islands exist.

I chose to keep the capitals of each country distinct in the Remain map. For the Leave land map I promoted Birmingham and Swansea to capitals (at least in a cartographic sense), being the next biggest cities in England and Wales, respectively. Having capitals helps the reader understand how these fictional nations would function.
Additional thoughts
Maps can help when trying to understand complex issues. Hopefully this map makes you think differently about how you visualise data in the future.
The great thing about this process is that it can be replicated in a number of ways with different basemaps and layers below the outline layer. I’ve included some alternate views of the maps with greater emphasis put on topographic features of the dataset.

This second visualisation uses a number of layers acting together as a basemap in the Imhof style, by fellow cartographer John Nelson. In this visualization I have decided to increase the transparency of the country outline layers, so as to create a sunken land effect of the old country. This view also allows the reader to see the old coastline and understand the differences in a geographic sense.
I hope these maps encourage you to challenge how data is presented and try new innovative design styles.
If you’re interested in talking maps please contact the Media Maps team on Twitter @RobACollins or @JessLHoughton