This might not be the update with the most new features but there are some interesting new options for presenting your data. Both the map viewer and scene viewer have new features and there are changes in the app templates and Web AppBuilder.
Clustering and updating images in Map Viewer
The Map Viewer now supports clustering for point layers. It’s activated as a layer setting and you can then choose how much clustering is applied – it is currently limited to WGS 84 or Web Mercator data and 50,000 features. The pop-up for clusters say how many features are represented and, if the symbology is by category or numeric, some summary information. The pop-up also has a browse features option. This lets you step through the pop-ups for the features and has a cool feedback that shows the extent of the cluster and the location of the current feature:
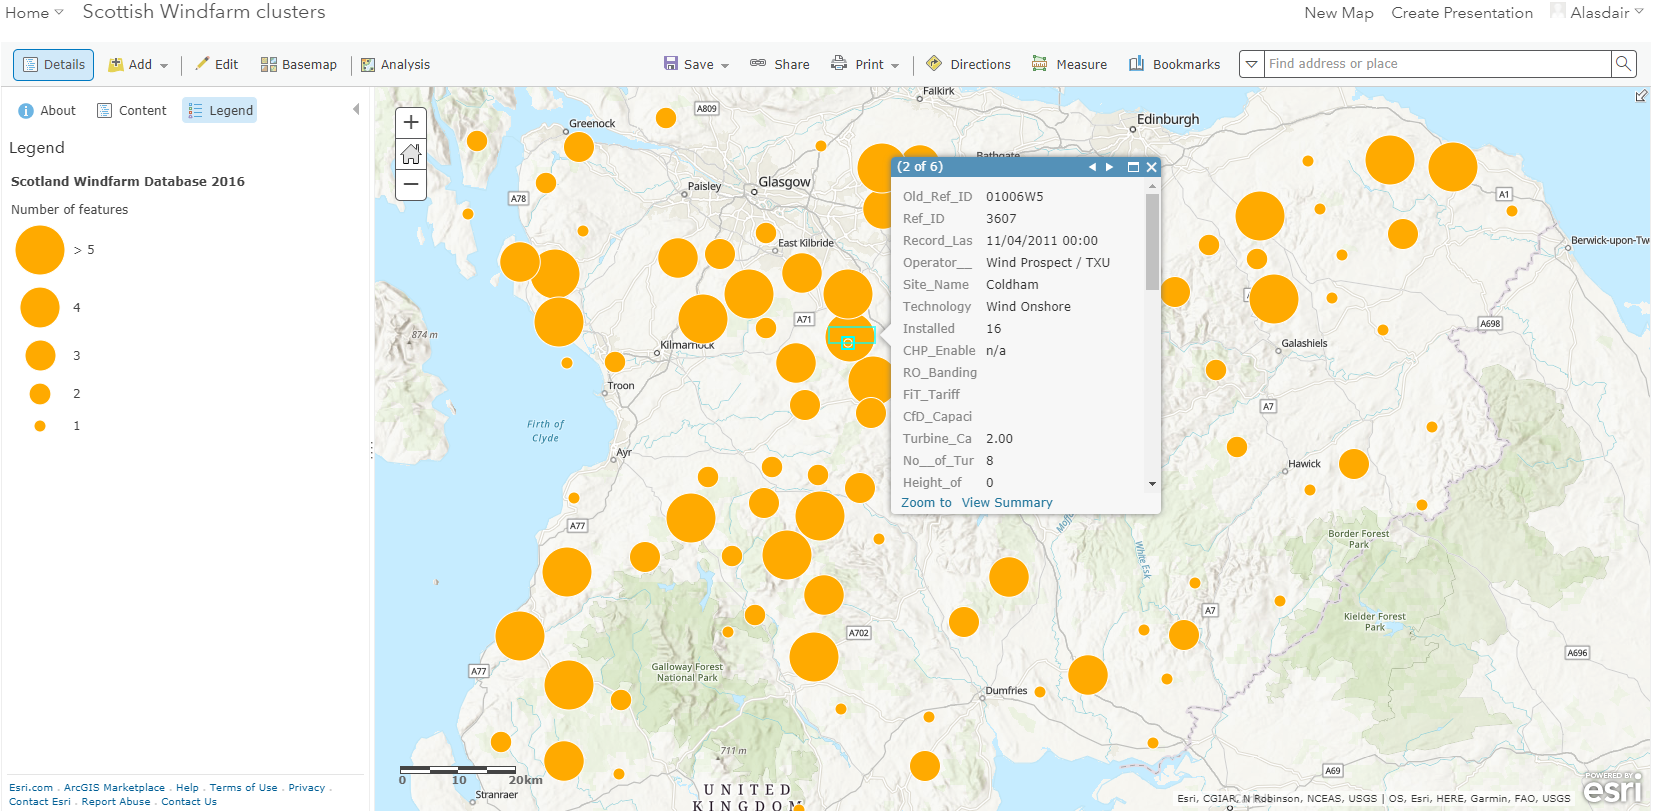
You can step through the options for clustering in this storymap.
Another new feature in the map viewer is the ability to set a refresh interval on images in pop ups, ideal if you are using the map to show something like traffic camera images.
There also some new symbol sets: local government, state government and emergency management. The icons are US-centric – I’m yet to need a bear track symbol for a map – but there are some good generic ones included.
Richer Scenes
The Scene Viewer now supports OGC Web Mapping Services (WMS). I can now use the BGS WMS service directly to see an area’s geology, with no need to manage the complex symbology.
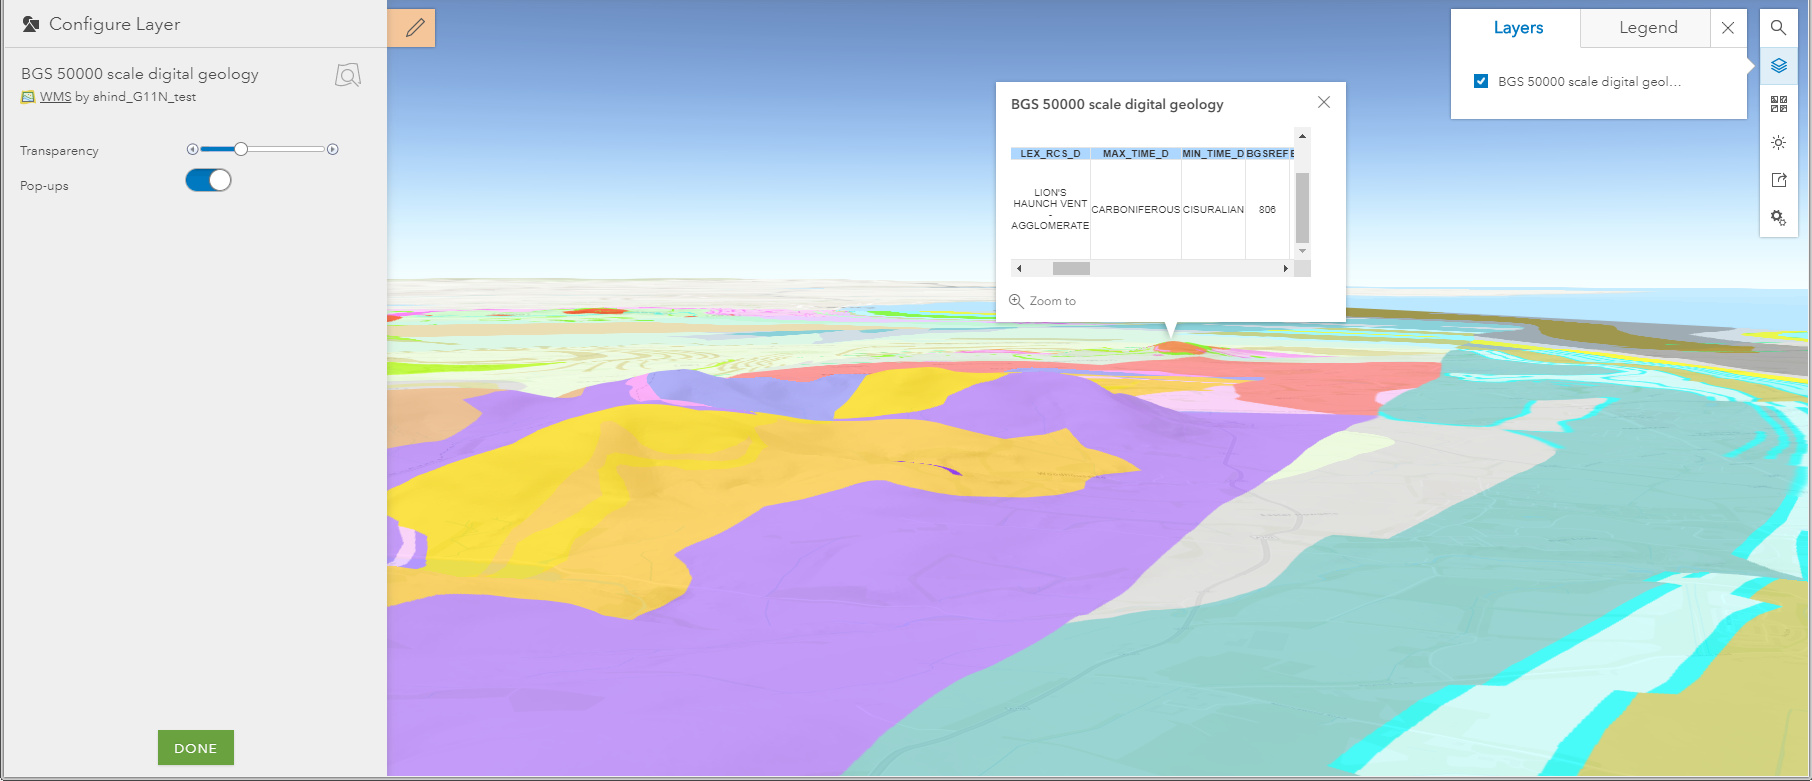
I can even get the details for the geology in an area through the pop-up. To use a WMS service just add it as a layer to your contents first.
Smart mapping for point clouds has also been added – making it easy to visualize the data by elevation, intensity, class code or true colour.
Restyling maps with Styler
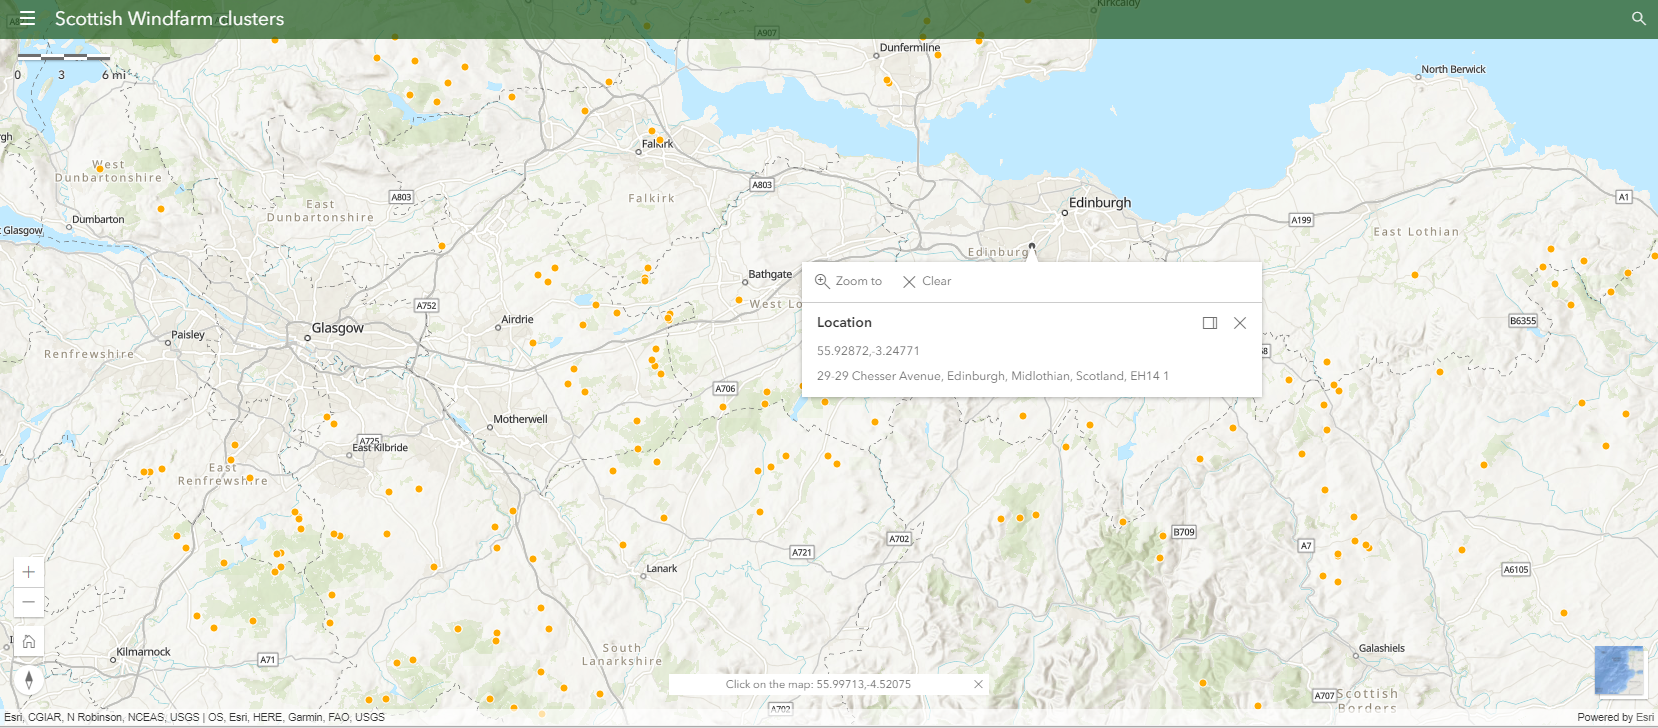
Back in the spring two new app templates were added in beta release – Map Styler and Scene Styler. These now get their full release and are a great way to create simple, modern map applications with a common style – for both 2D and 3D. I had a go at creating an example map which was all very straightforward. It includes a nice tool for showing the coordinates the map is centred on that flips into a location tool (click the map point icon) – now when you click on the map you get the coordinates and address information for the location:
Then I discovered the really cool bit – you can change the layout and look of an existing map using URL parameters!!
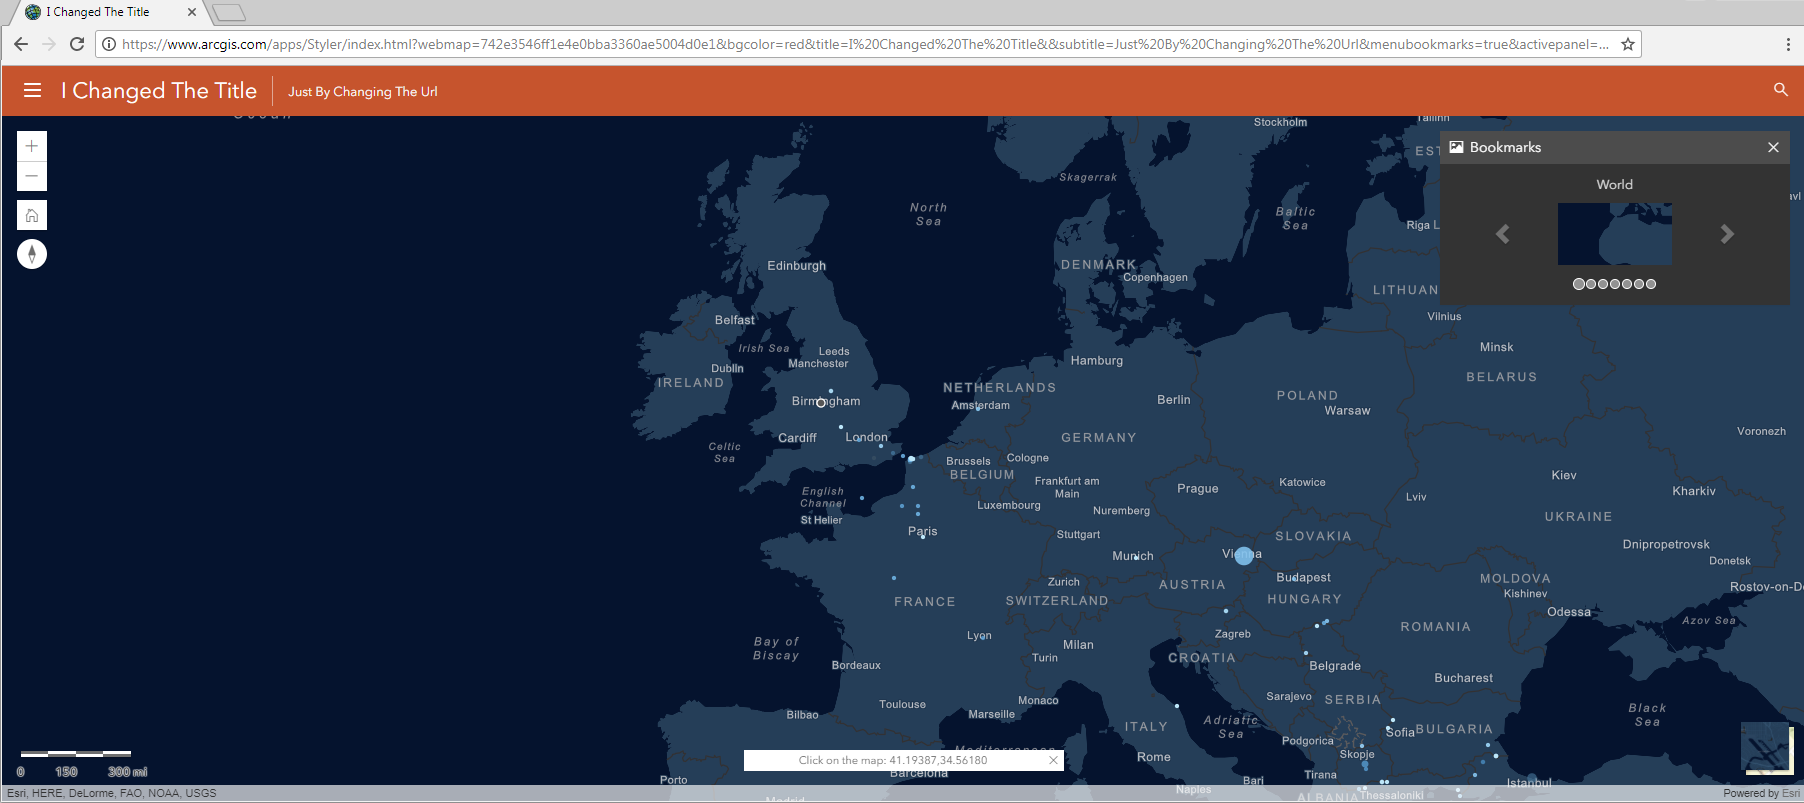
Have a go – the base app I used is here and I added these parameters to the url to change the title, the colour and have the bookmark tool active(you can also move the map controls):
    &title=I%20Changed%20The%20Title&subtitle=Just%20By%20Changing%20The%20Url
    &bgcolor=red&menubookmarks=true&activepanel=bookmarks
Styler is built on the Calcite Maps framework, giving consistency to the web application structure, and Bootstrap to ensure responsive design. There’s a bit more technical information in this blog and some more examples to play with.
And that’s not all….
There is a new option to create Locator Views to run constrained searches against the World Geocoding Service. Options include limiting the search to a country, to an address level (city, street etc) or to particular types of place.
Accessibility improvements have been made to the Story Map Journal. Enhanced keyboard navigation has been added to follow WCAG 2.0 web content accessibility guidelines.
If you use the Web AppBuilder then look out for refinements to some of the widgets. These include new configuration options for Bookmark – to display bookmarks in cards and list styles, re-order bookmarks, and control whether users can add bookmarks.
Esri vector basemaps have been updated with the latest commercial data for North America, South America, and Europe.
As ever, please check the what’s new page for the full list of changes.
![]()