With the summer cycling season in full swing, I felt it was a great time to investigate combining exercise routes and GIS. With the help of my cycling-obsessed brother, I managed to acquire some fascinating cycling data, spanning several years.
Before I describe the steps to create the visualisation, it’s worth showing you the final product first – click here. His Strava data was recorded over the last 5 years and shows 16,000km of cycling routes, traversing across the whole of the UK. Something to note before continuing, I have used both ArcGIS Pro and Data Interoperability for this, which requires a Data Interop extension license (it is possible to 30-day trial both products).
The first step was to bulk download the Strava data, which can be achieved through these steps. This will download each ride as a separate GPX file (after being unzipped).
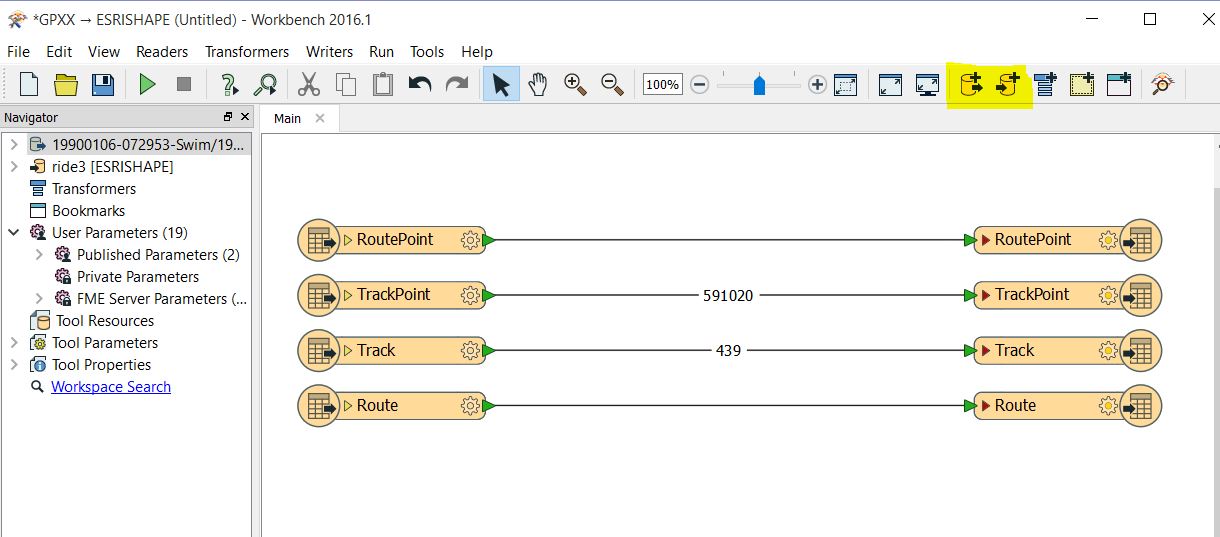
I then needed to convert these GPX files into a feature class, which was done by using the Workbench programme (Data Interoperability required). The two main steps of using this programme are to Add Reader and Add Writer, which allows you to specify the input and output (seen highlighted in yellow). For the example below, using Add Reader I selected 4 of the fields that I wanted to be featured in the final output feature class. Once I had connected the input to output with arrows, it was ready to run. The benefit of using the Workbench process meant it used all 300 cycle routes and created them into one single shapefile, making it extremely easy to manage.
Now I have a single shapefile that contains all my rides and can be easily opened in ArcGIS Pro. The challenge now, is how to display this data so that it not only accurately presents the original data, but also draws attention to frequently visited areas. This was primarily achieved through the symbology settings, applied against the Dark Grey Canvas basemap. I used the single symbol option from the symbology dropdown, specifying the line width to 1pt. For the colour properties, I selected a bright pink colour and changed the transparency to 50% (hex code: FF00C5).
The final product allowed me to see each route in detail, but also zoom out to a wider scale to view the clusters of busy areas.
Relive
I discovered the Relive app through Esri’s Instagram (@esrigram) and felt it would be worth mentioning in a Strava orientated blog post. Relive allows you to create a 3D fly-through video of your Strava activity, that’s easy to share and export. It uses the GPS data from Strava and combines it with the Esri 3D basemap, creating a stunning video of your journey. All it requires is for you to be connected between Relive and Strava before you go for a cycle (as it can’t work on retrospective rides, unfortunately). Here is an example of one we created at Esri UK for our charity walk up Helvellyn (although it doesn’t show you how much it rained!) – https://www.relive.cc/view/984606568
![]()